
Aggregated monitoring of BizTalk solutions using 'BizMon'
> > **Update 2010-09-30:** BizMon is now owned and developed by [Communicate Norway](http://www.communicate.no). They have renamed, and further developed the product, to IPM (Integration Monitoring Platform) – check it out [here](http://ipm.communicate.no/exciting-news). > >
> > _**Update 2009-08-11: **This project turned out to be far more complicated and bigger than I first expected (ever heard that before?). Due to that and the fact that we wanted to have a company behind that could offer full-time support and stability “BizMon” has been released as a commercial product that you can find [here](http://bizmontool.com/). _ > > > > _I love to get some [help from you](http://bizmontool.com/we-have-a-rtm-version)**** to test it and make it as good as possible. Even if it is commercial and cost money we have a free alternative for small environments and we work hard to keep the license price as low as possible._ > >
****
> > _**Update 2009-02-25:** In the original post I said I'd post more on the architecture and the code during February 09. I'm however current struggling getting the needed legal rights etc, etc to be able to talk further about the "BizMon"-solution. It was harder than I thought ... I'll get back to posing on the subject as soon as I have that sorted._ > >
Integration of enterprise processes often ends up being very business critical. If a integration fails delivering the messages it was supposed to it usually means the business will be affected in a very negative way (for example losing money or delivering bad service). That of course means that monitoring the status of the integrations soon becomes very important (if you’re not into getting yelled at or potentially loosing your job).
Strangely enough BizTalk Server 2006 R2 _in my humble opinion_ doesn’t come with the right tool to efficiently monitoring big enterprise integration solutions!
What do I mean by monitoring?
 Before I get myself deeper into trouble I’d like to define what I mean by monitoring. I think monitoring a BizTalk integration solution could be divided into four categories.
-
Infrastructure **(traditional)
**This is the easy one and one that IT-pros and alike are used to monitor. Hardware status, network traffic, disk space, event logs etc all fall under this category. If the storing area for the databases start running low on memory we can be pretty sure it’ll eventually effect the integration somehow. -
**BizTalk infrastructure
**This is where it starts getting a bit trickier. This category includes the status of receive locations, orchestrations, host instances and send ports. If a receive location is down no messages will be picked up (but we can also be sure of not getting any suspended messages). -
**Suspended messages
**As most reader of this blog probably know suspended message is due to some sort of failure in BizTalk. It can be an actually exception in code or something that went wrong while trying to send messages. It’s however and important category to monitor. -
**Heartbeat (monitoring actual successful traffic)
**While the points 1-3 above focuses on errors and that things being inactive this category actually monitors that the integration runs as expected.
To me this final point is almost the most important one. What I mean is that if everything runs as expected and we’re sending the expected amount of messages in the right pace everything else must be ok - right? It’s however the one that in my experience almost always overlooked!
“What do you mean ‘Not the right tools to monitor’? We have loads of tools in BizTalk 2006 R2!”
OK. So let’s see what tools we have available actually monitor the categories above.
-
Infrastructure **(traditional)**
I won’t discuss this kind of monitoring in this post. There are loads of tools (all from the huge expensive enterprise ones to plenty of good open-source alternatives) for this and you’re probably already using one or several of them already. -
**BizTalk infrastructure
**There are a couple of way of achieving this. One of the is to use the Microsoft BizTalk Server Management Pack for Operation Manager. It does however of course require that you have invested in System Center Operation Manager already …
Another way is to either use the ExplorerOM classes or connecting directly to the BizTalk configuration database and code your own report of some sort.
The final (and most common way in my experience) is to try and document the correct configuration and settings and then have someone check these manually (if you’re that person I feel for you …).
- **Suspended messages
**Suspended messages are of course very important to monitor and it’s for some reason also the first thing developers think of monitoring when developing BizTalk integration (maybe because of the fact that they’re similar to traditional exceptions in software). There are also here a couple of different ways to solve the problem.
Microsoft BizTalk Server Management Pack for Operation Manager mentioned above has the functionality to monitor and altering on suspended messages.
BizTalk Server fires the MSBTS_ServiceInstanceSuspendedEvent WMI event every time a service instance gets suspended. It’s fully possible to write a service that watches for this event and then for example sends some sort of alert. Darren Jefford has an example on how do something like that in this post.
In BizTalk 2006 Failed Message Routing was introduced. This gives the developer the possibility to subscribe to suspended messages. These can then for example be sent out to file system or written to a database. Microsoft ESB Guidance for BizTalk Server 2006 R2 Exception management component uses this approach. The problem with this approach is however that the message is moved out of BizTalk and one loses all the built in possibilities of resending them etc.
- **Heartbeat (monitoring actual successful traffic)
 As I said before I think this is a very important metric. If you can see that messages travel through BizTalk in a normal rate things much be pretty ok – right? Without doing to much coding and developing you own pipeline components for tracking etc there are two options.
**
The first one is of course using the Health and Activity Tracking tool (HAT). This shows a simple view of receives, processed and sent messages. I hate to say it but the HAT tool is bad. It’s slow, it’s hard to use, it’s hard to filter information, it times out, it doesn’t aggregate information, it’s basically almost useless … (Just to make one thing clear: I make my living working with BizTalk and I really enjoy the product but tracking and monitoring is really one of it’s ugly sides. I hate to say it.)
The other option is to develop a simple BAM tracking profile to monitoring the send and receive port ports of the different processes.
So to repeat what I said earlier: no I don’t think BizTalk comes with the right tool to monitor integration solutions. I do however think that the platform has the capabilities to create something that could close that gap in the product.
What I need!
Much of what’s discussed in this post can be solved using the BizTalk Administrations Console (to manually monitor BizTalk infrastructure status) or in the Health and Activity Tracking tool (to manually monitor traffic). The aim of this post is however to discuss the possibilities to use this information, aggregate it and give the persons responsible for monitoring integration a dashboard that shows the current status of all integrations within the enterprise.
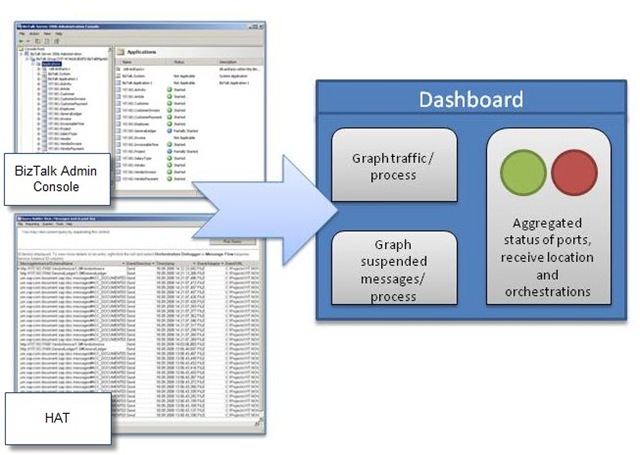
The dashboard monitor application need the following main features.
-
In one single screen give an overview of the overall status of all the integrations. By status I mean if there are ports, orchestration or host instances that aren’t running that should be running or if there is any suspended traffic on that particular integration.
-
The possibility to show detailed information for a specific integration on what artifacts (ports, host instances etc) that are/aren’t running. How much traffic that’s been sent/received via the integration. When traffic was sent/received and if there’s any suspended messages on the integration.
-
The option to filter exclude specific artifacts from monitoring (for example receive locations that’s usually turned off etc).
-
Setting up monitoring by for example email and also define what integrations to be included in one specific monitoring (different persons are usually responsible for monitoring different integrations).
Introducing “BizMon”
Based on the needs and “requirements” above I’ve started developing a application. The idea is to release it as open-source as soon as I get to a first stable version (I’d be very interested in help on practical details on how to do so). For now I’ll demonstrate it by showing some screenshots. The application is a web application based on ASP.NET MVC.
Screenshot: “Applications” page

The above image shows a screenshot from the start page of the BizMon-application that shows the aggregated status of the entire BizTalk group it’s connected to. The applications is build to monitor one BizTalk group and the shown page displays all applications within that BizTalk group.
In the example image the two first rows have an OK status. That means that all of the monitored artifacts (receive locations, send ports, orchestrations and host instances) within that application are in a running and OK status.
The yellow line on the YIT.NO.Project-application indicates a warning. That means that all the artifacts are in a OK status but there’re suspended messages within that application. The red line indicates that one or more of the monitored artifacts are in a inactive status.
Each row and application show when the last message on that application was received and/or sent. It also show how many suspended messages exists and when the last message got suspended.
Screenshot: “Application-detail” page
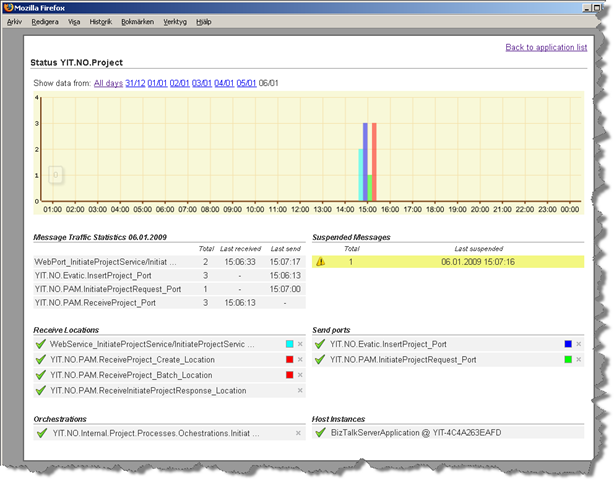
When clicking on a application on the main page previously shown the application-detail page is displayed for that application. This page shows detailed information on each of the artifacts within that application. I also shows suspended messages and the date and time of the last suspended.
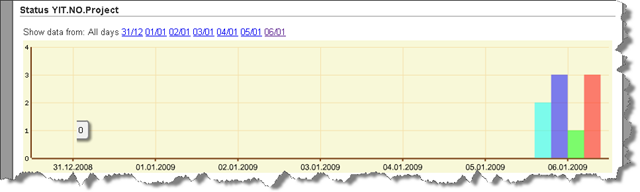
It also displays a graph showing how many messages that has been processed by each of the ports. Currently the graph can view data from the last 7 days. In the screenshot above data from the 6th of January is shown and as it’s set to display data for a specific day the data is grouped in hours of that day. It’s also possible to view the aggregated data from all the traced days as show below. When viewing data from all days the graphs is grouped by days.
(The graph only shows data from the 6th of January as this is from test and there was no traffic of the previous days but I’m sure you get the idea …)
Screenshot: “Application-detail” page with inactive artifacts
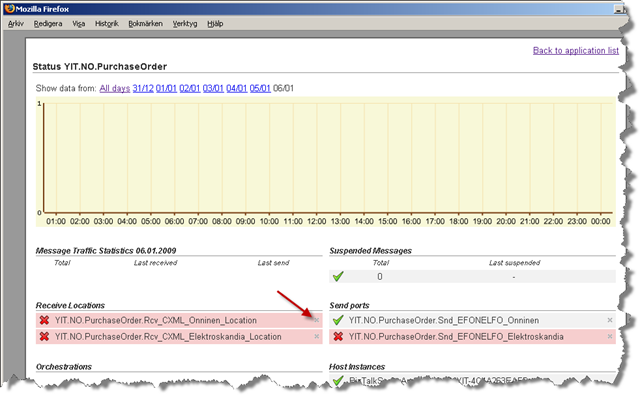
This final page show details of an application with some inactive artifacts. The small cross highlighted by the arrow in the image show the possibility to filter out a single artifact from monitoring. If an excluded artifacts is failing the overall status of the application will still be OK and no alerts will be sent.
Help!
I’d love to get some input and feedback on all this. What do you think could be useful, what do you think won’t? Do you know of something similar, how do you solve this kind of monitoring?
I’d also like to know any suitable placed to publish the code as an open-source project or is the best thing to just release it here on the blog? What do you think? Use the comments or send me a mail.
What’s next?
I have a few thing on the alerts part of the application left and then I’ll release a first version. I’m hoping that could happened at the end of February 09 (look at the update at the top of the post) . Make sure to let me know what you think!
I’ll publish a follow-up post discussing the technical details and the architecture more in detail shortly.